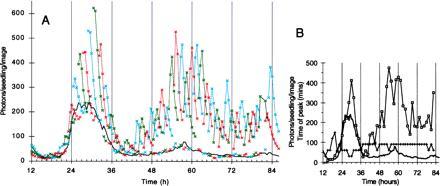
Figure 2.

Circadian modulation of the acute response to light. Light-grown plants were transferred to DD at the normal lights-off time of the preceding LD12:12 (12 h). Replicate samples (a total of 47) received 30 min light every 1.5 h (marked by ticks above the time axis). Eight images were collected for each sample at 30-min intervals, two before and six after the light treatment. A dark control sample was imaged every 30 min, and is included as a reference in each graph (solid line). Data are representative of three experiments. Data points were lost at 80.5 and 81 h. (A) Data from successive samples are graphed in red, blue, and green for clarity. A gap in each trace marks the time of the light pulse. (B) The peak amplitude of each acute response after subtraction of the dark control level (squares), and the kinetics of induction measured as the time (min) between the light pulse and the image that gave the peak luminescence (crosses).
