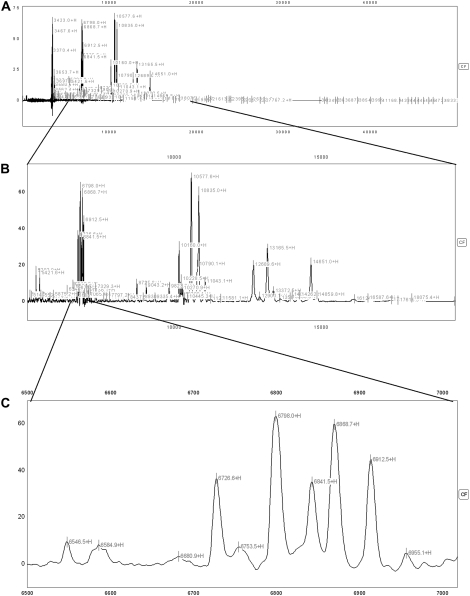
Figure 2.
This figure demonstrates spectra from an individual with cystic fibrosis (CF) on the CM10 (cationic exchange) surface shown at different magnifications demonstrating the abundance of peaks in an individual sample. (A) demonstrates the entire spectrum (3,000–50,000 D); each label (most of which cannot be discerned individually at this magnification) represents a peak with signal-to-noise ratio of more than 3. (B) demonstrates some magnification to cover the spectrum from 5,000 to 20,000 D; again, most of the individual labels cannot be seen clearly at this magnification. (C) demonstrates magnified spectrum from 6,500 to 7,000 D, and at this level the individual peaks can be easily discerned.

