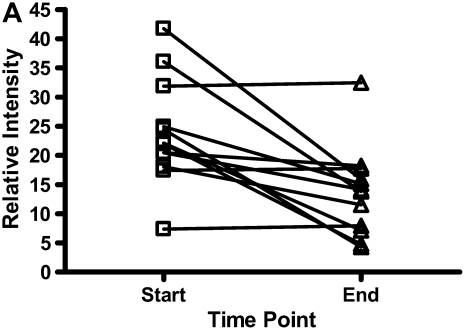
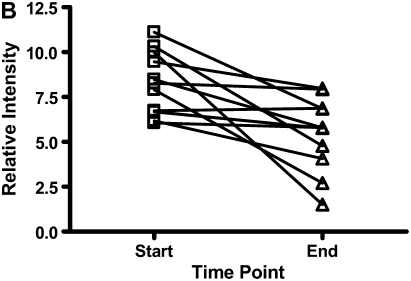
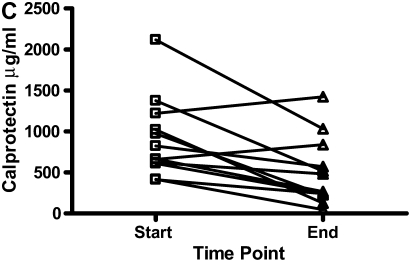
Figure 6.
The results for calgranulins A and B/calprotectin for 12 patients with cystic fibrosis are shown at the onset of an infective exacerbation and at the completion of antibiotic therapy, when there was a decrease (P < 0.01) of the proteins measured. (A) shows data for calgranulin A; (B) shows data for calgranulin B; (C) shows data for calprotectin measured by ELISA.


