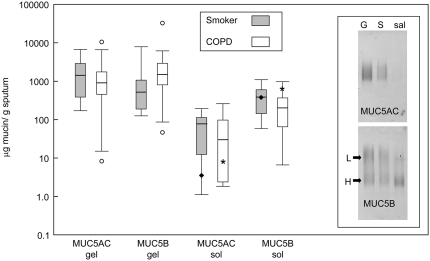
Figure 1.
Amount of MUC5AC and MUC5B mucins in sputum and saliva collected from study subjects. The concentration of MUC5AC and MUC5B in the sol and gel phases of sputum, and saliva, were determined by quantitative Western blotting (see Methods). Data are presented as μg/g of total sputum or saliva for chronic obstructive pulmonary disease (COPD) (open bars) and smokers with no airflow obstruction (gray bars). The data are presented as box and whisker plots; the median (horizontal line inside bars) is shown, as well as a box showing the interquartile ranges (25th and 75th percentile); individual outlier points beyond the 10th and 90th percentile are indicated (open circles, only seen in patients with COPD).The asterisk and the solid diamond on the data shown for the sol indicate the median value for MUC5AC and MUC5B in the saliva from the two groups. Inset shows an example of agarose gel separation of MUC5AC and MUC5B mucins from gel (G) and sol (S) phases of sputum and saliva (sal) of a single individual. The different glycoforms of MUC5B are highlighted; low charge (L) and high charge (H). The gel shown was loaded with different amounts of sample to highlight the different mucins present and was not used for quantitative analysis.

