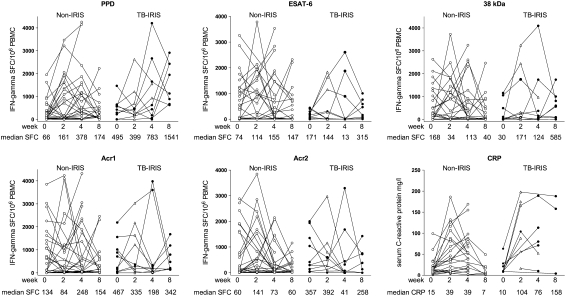
Figure 3.
Longitudinal analysis of the frequency of M. tuberculosis antigen–specific IFN-γ spot-forming cells in response to five antigens and C-reactive protein (CRP) in HIV-TB patients receiving combination antiretroviral therapy (cART). An open triangle in the TB–IRIS group indicates the point at which tuberculosis-associated immune reconstitution inflammatory syndrome (TB–IRIS) was diagnosed. Repeated measures analysis demonstrated a significant increase in PPD response only in the TB–IRIS group (P = 0.041). Within-category analysis confirmed the increase in median PPD response in the TB–IRIS group between Weeks 0 and 8 to be significant (P = 0.008). In addition, the increase in PPD response in the non-IRIS group between Week 0 and both Weeks 2 and 4 was significant (P ≤ 0.04). When comparing IRIS and non-IRIS groups the only significant difference was between the 8-week response to PPD (P = 0.001). The increase in median CRP response in the TB–IRIS group from between Weeks 0 and 2 was significant (P = 0.031). In addition, the increase in CRP in the non-IRIS group between Week 0 and both Weeks 2 and 4 (P ≤ 0.006) was significant. When comparing IRIS and non-IRIS groups significant differences in CRP were found between the 2-week response in the non-IRIS group when compared with those who developed TB–IRIS (P = 0.027).

