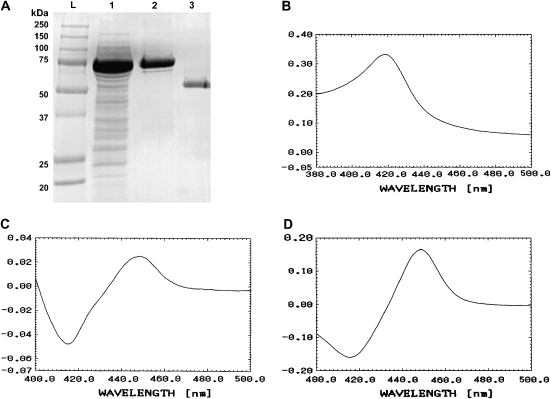
Figure 1.
(A) SDS-PAGE analysis of Mycobacterium avium complex (MAC)-CYP51 expressed in Escherichia coli. Lane L is the molecular weight ladder, lane 1 is bacterial lysate, lane 2 is the glutathione S-transferase (GST)–purified fusion protein, and lane 3 is the thrombin-cleaved MAC-CYP51. (B) Absorption spectrum of absolute oxidized form of MAC-CYP51, (C) the dithionate reduced form, and (D) the carbon monoxide reduced form.

