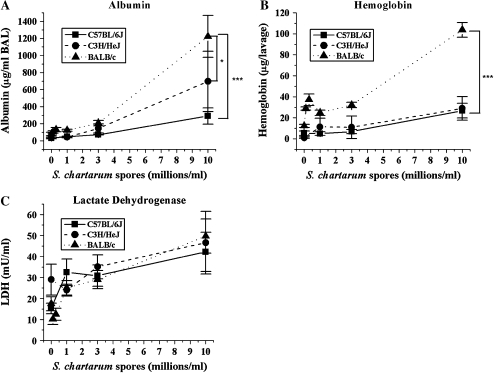
Figure 1.
Dose response of albumin, hemoglobin, and LDH. (A) Mean concentrations of albumin in BAL fluid ± SEM versus instilled dose S. chartarum. (MANOVA, spore dose to albumin slope different at P = 0.0007 for C57BL/6J versus BALB/c, P = 0.03 for C3H/HeJ versus BALB/c, and P = 0.3 for C57BL/6J versus C3H/HeJ). (B) Mean concentrations of hemoglobin in BAL cell pellet ± SEM versus instilled dose S. chartarum. (MANOVA, spore dose to hemoglobin slope different at P < 0.0001 for C57BL/6J versus BALB/c, P < 0.0001 for C3H/HeJ versus BALB/c, and P = 0.8 for C57BL/6J versus C3H/HeJ). (C) Mean concentrations of LDH in BAL fluid ± SEM versus instilled dose S. chartarum (MANOVA, spore dose to LDH slope different at P = 0.5 for C57BL/6J versus BALB/c, P = 0.2 for C3H/HeJ versus BALB/c, and P = 0.5 for C57BL/6J versus C3H/HeJ). * Slopes of lines significantly different at P < 0.05; *** slopes of lines significantly different at P < 0.005.

