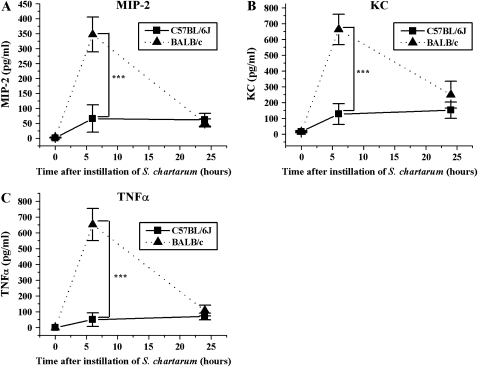
Figure 4.
Time course of MIP-2, KC, and TNF-α. (A) MIP-2 in BAL ± SEM versus time after instillation of 10 million spores S. chartarum/ml (2.5 ml/kg body weight) (t test, P = 0.005). (B) KC in BAL ± SEM versus time after instillation of 5 × 10⁵ spores S. chartarum/20-g mouse (t test, P = 0.002). (C) TNF-α in BAL ± SEM versus time after instillation of 10 million spores S. chartarum/ml (2.5 ml/kg body weight) (t test, P = 0.0007). ***P = 0.005.

