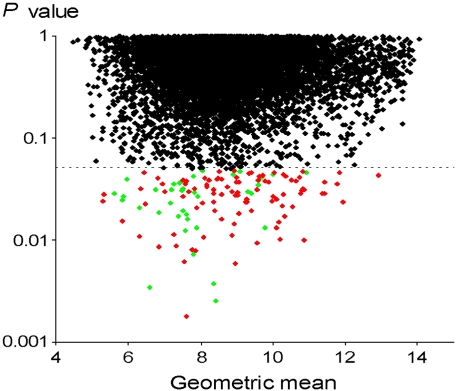
Figure 1.
Genes significantly different under conditions of hyperoxia versus normoxia in five patients for expression of 9,787 genes evaluated in bronchial epithelial cells. The P values were calculated for each gene called “Present” and found in at least three of the four microarrays in each condition using the Welch t test. Ordinate, P value for each gene; abscissa, geometric mean of values in normoxia and hyperoxia, that is, 0.5 × (log2Nor + log2Hyp) (68). Genes significantly overexpressed in hyperoxia are in red, and significantly underexpressed in hyperoxia in green.

