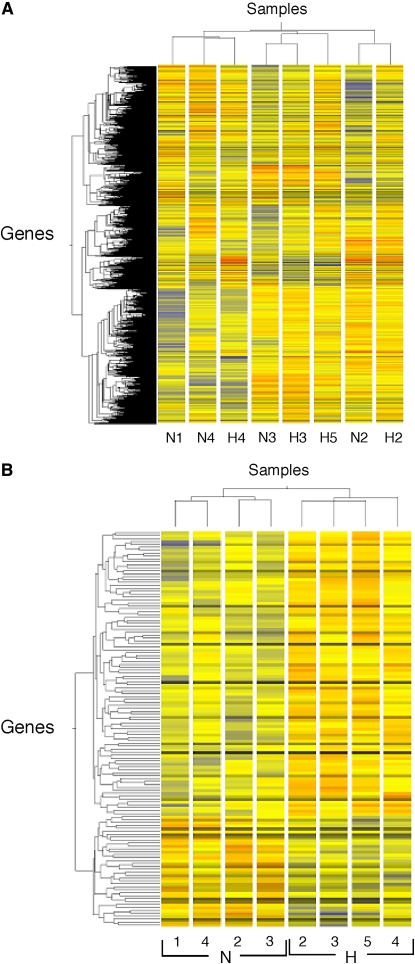
Figure 2.
Hierarchical clustering of all 9,787 genes (A), or the subset of 135 genes differentially expressed according to a P value below 0.05 between hyperoxia and normoxia (B). Gene and condition trees were generated by hierarchical clustering of genes called “Present” in at least three of the four microarrays using the Pearson correlation. N refers to normoxia, H to hyperoxia, with numbers identifying volunteers. Using all genes (A), clustering occurs by pairs; for example, N3 and H3 are paired normoxia and hyperoxia of Volunteer no. 3. Using the subset of genes (B), clustering is by normoxia and hyperoxia groups. Individuals N1 and H5 are unpaired conditions of normoxia and hyperoxia, respectively.

