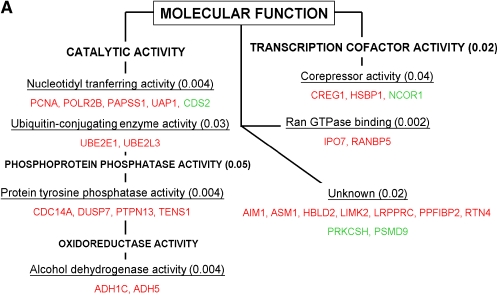
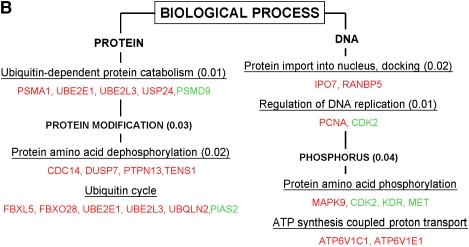
Figure 3.
Selected cellular pathways triggered by hyperoxia according to the significant biological processes (A) and the molecular functions (B) involved using the GOMINER approach. Upregulated genes are represented in red and downregulated genes in green. P value of functional categories, using Fisher's exact test, are presented in parentheses. See tables for gene descriptions.


