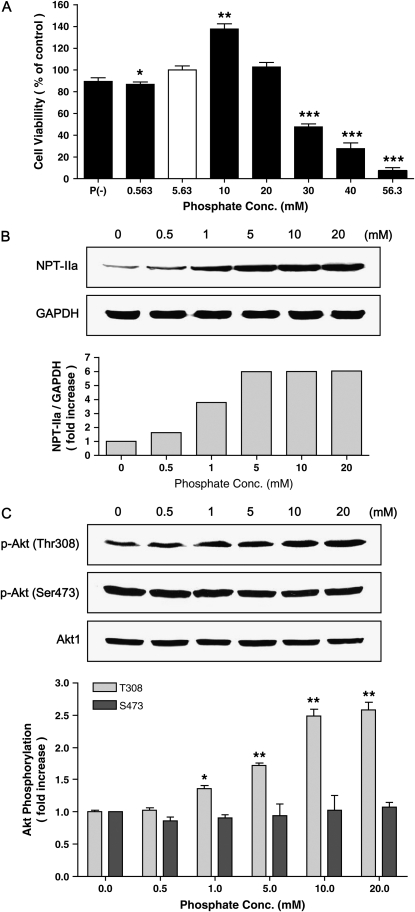
Figure 1.
Concentration-dependent effects of inorganic phosphate (Pi) on NHBE cells. (A) NHBE cells were treated with various concentrations of Pi and incubated for 48 h, and cell viability was measured using MTT assay. The open bar represents the control/normal media containing 5.63 mM Pi, whereas filled bars represent different Pi concentrations. (B) Concentration-dependent NPT-IIa protein expression. NHBE cells were treated with increasing concentrations of Pi (0–20 mM) for 24 h and 25 μg of protein lysate was used for Western blot. Upper panels, Western blot; lower panel, densitometric analysis. (C) Concentration-dependent Akt phosphorylation on Thr308 and Ser473. NHBE cells were treated with increasing concentrations of Pi (0–20 mM) for 24 h and 25 μg of protein was used for Western blot. Upper panels, Western blot; lower panel, densitometric analysis. Open and filled bars represent degrees of phosphorylation of Akt at Thr308 and S473, respectively. Values are the means ± SE of three independent experiments. *P < 0.05, **P < 0.01, ***P < 0.001.

