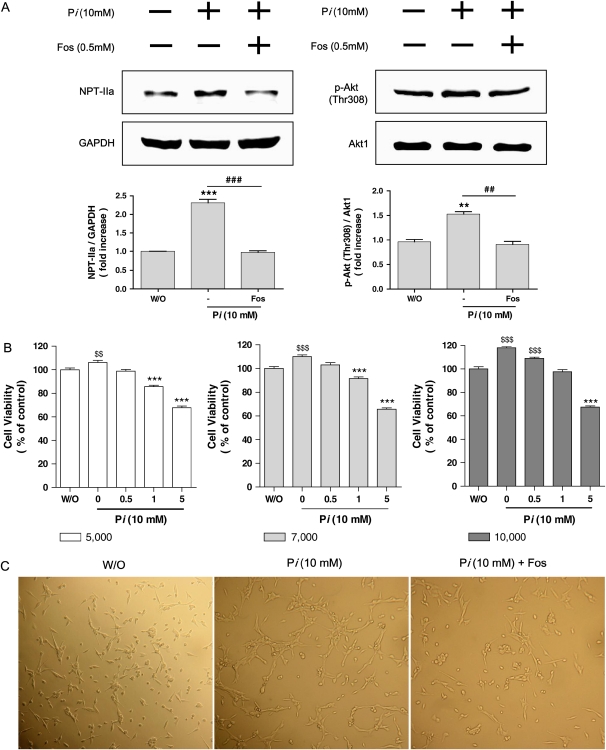
Figure 3.
Effects of phosphate transport inhibitor on NPT-IIa, Akt phosphorylation, and cell growth. Cells were pretreated with Foscarnet phosphate transport inhibitor for 30 min, and then 10 mM of Pi was added for an additional 24 h. After 24 h, cells were lysed and 25 μg of protein was used for Western blot. (A) Changes of NPT-IIa protein (left panels) and Akt phosphorylation at Thr308 (right panels) were detected by Western blot. GAPDH and Akt1 were used as each corresponding internal standard. Upper panels, Western blot; lower panels, densitometric analysis. Values are the means ± SE of three independent experiments. **P < 0.01, ***P < 0.001 versus without Pi, ##P < 0.01, ###P < 0.001 versus without inhibitors. (B) Effects of various concentrations of Foscarnet on viability of cells treated with/without Pi measured by MTT assay. Three different numbers of cells grown in 96 wells (left: 5,000 cells/well; middle: 7,000 cells/well; right: 10,000 cells/well) were treated with increasing concentrations of Foscarnet (0–5 mM) in 10 mM of Pi. Based on above study, optimal concentration of Foscarnet (0.5 mM) as well as appropriate cell number (7,000 cells/well) were selected for further studies shown in panel C. $$P < 0.01, $$$P < 0.001 significantly increased compared with control, and ***P < 0.001 significantly decreased compared with control. (C) Effects of Pi on cell growth. Cells (7,000 cells/well) were grown in wells and treated with Pi in the presence or absence of 0.5 mM Foscarnet and observed under ×200 magnification. Pi caused the increase of cell size (middle panel) compared with control (left panel); however, Foscarnet treatment suppressed the cell growth significantly (right panel). The photograph is representative of three independent experiments. For all above studies, control cells were treated with 10 mM Na2SO4 to clarify the potential effect of salts. Note that the pattern of negative control was almost identical to that of control cells (data not shown).

