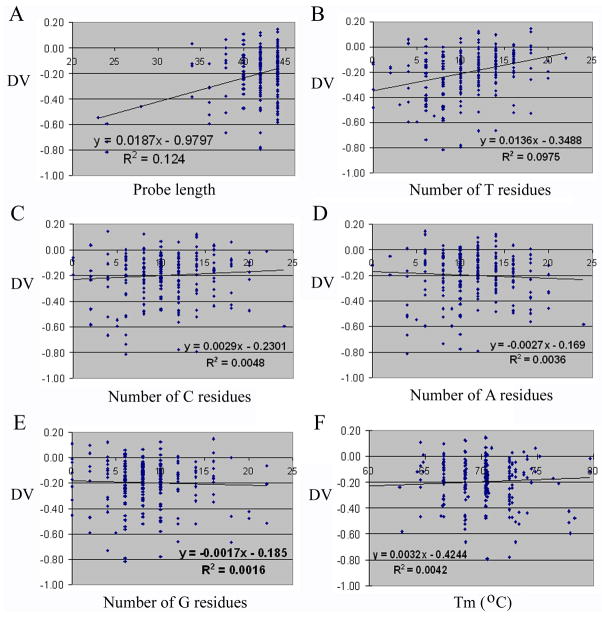
Fig. 3.
Scatter plots of DVs versus various attributes of microarray probes. Spots in the graphs represent individual probes. DVs are shown on the y-axis. Trendlines, equations, and R2 values were generated using Excel. (A) Probe length on the x-axis. (B) The number of T residues in each probe on the x-axis. (C) The number of C residues in each probe on the x-axis. (D) The number of A residues in each probe on the x-axis. (E) The number of G residues in each probe on the x-axis. (F) Tm on the x-axis.

