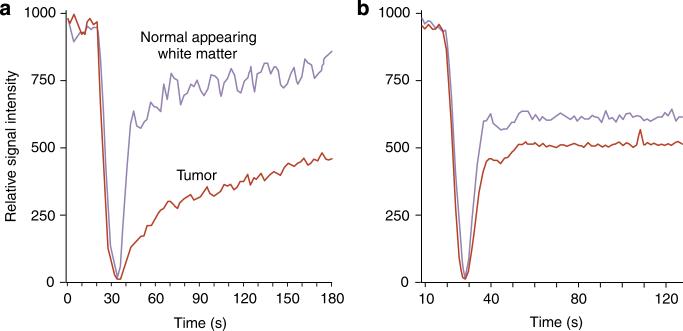
Figure 9. Perfusion MR, time-intensity curves in a patient with pineal blastoma.
(a) Using GBCA, leakage of the contrast agent decreases the slope of the recovery curve in the tumor. (b) Ferumoxytol signal intensity curves show no leakage in the lesion.3 (Reproduced from Neurosurgery 2007; 60: 601−611; discussion 611−602 with permission of Lippincott, Williams & Wilkins, 2008).

