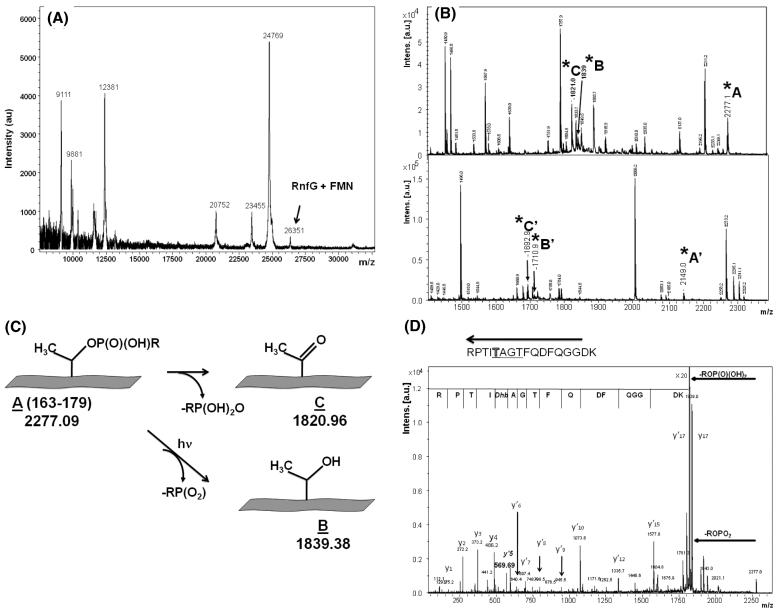
Figure 4.
(A) MALDI mass spectrum of RnfG. The peak corresponding to RnfG with the covalently attached FMN is shown. (B) MALDI mass spectra of two fluorescent FMN-containing peptide fractions in m/z range 1200-2400. Peaks corresponding to modified threonine are marked as A, A′, B, B′, C, and C′. (C) Scheme illustrating the two mechanisms of phosphoester bond breaking leading to the results shown in (B). (D) MS/MS (postsource decay) mass spectra of the MS peak at m/z 2277, showing the protein sequence in the vicinity of T175 including the TGAT flavin binding motif. The dephosphorylated state of Thr-175 is evident.

