
Figure 2. Opioid Withdrawal.
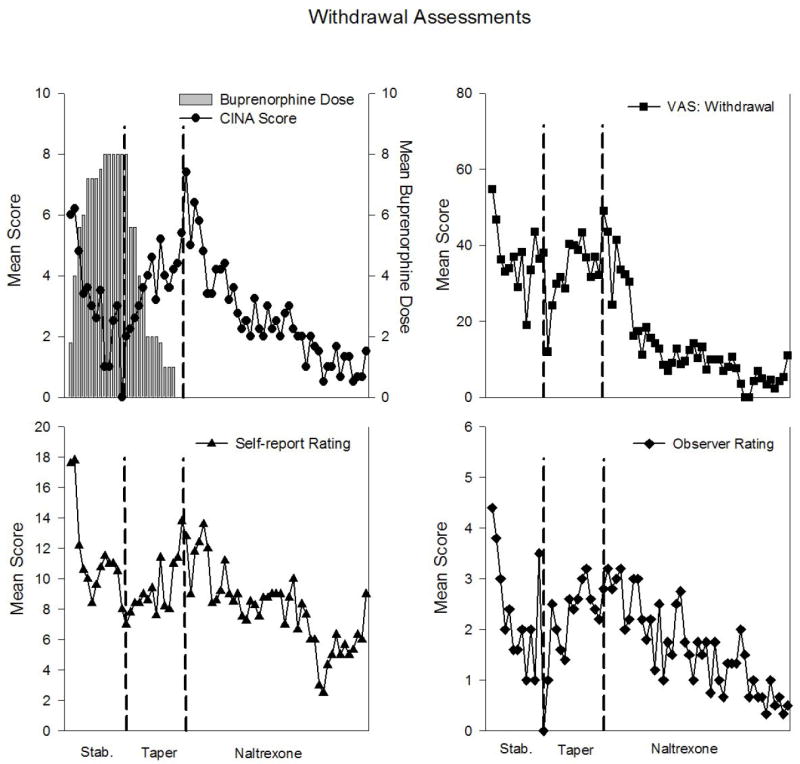
Data represent mean withdrawal measures among Responders (n=5), collected immediately prior to administration of study medication. Vertical lines distinguish stabilization, taper and naltrexone phases. Upper left panel: Mean CINA scores (range 0 – 30; left y-axis) and mean buprenorphine doses (mg; right y-axis) across consecutive study visits. Upper right panel: Mean score on self-report visual analog (range 0 – 100) item “Do you feel any withdrawal discomfort right now?” Lower left panel: Mean score on self-report Withdrawal Adjective Rating Scale (range 0 – 84). Lower right panel: Mean withdrawal severity score on observer-rated modified Himmelsbach assessment (range 0 – 12).