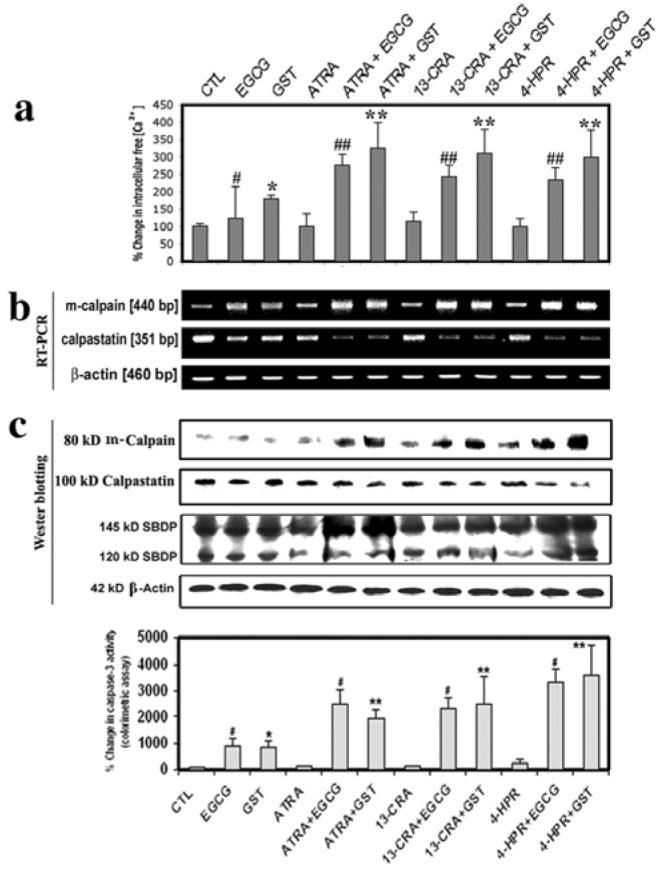
Figure 6.

Determination of intracellular free [Ca2+] and activities of calpain and caspase-3 in SH-SY5Y cells. Treatment with retinoid (7 days) and flavonoid (24 h): CTL, 25 μM EGCG, 25 μM GST, 1 μM ATRA, 1 μM ATRA + 25 μM EGCG, 1 μM ATRA + 25 μM GST, 1 μM 13-CRA, 1 μM 13-CRA + 25 μM EGCG, 1 μM 13-CRA + 25 μM GST, 0.5 μM 4-HPR, 0.5 μM 4-HPR + 25 μM EGCG and 0.5 μM 4-HPR + 25 μM GST. (a) Determination of percentage of increase in intracellular-free [Ca2+]. (b) Representative gel pictures with RT-PCR products to show the mRNA levels of m-calpain, calpastain and ß-actin. (c) Representative Western blots to show the levels of m-calpain, calpastatin, SBDP and ß-actin. (d) Determination of caspase-3 activity using a colorimetric assay.
