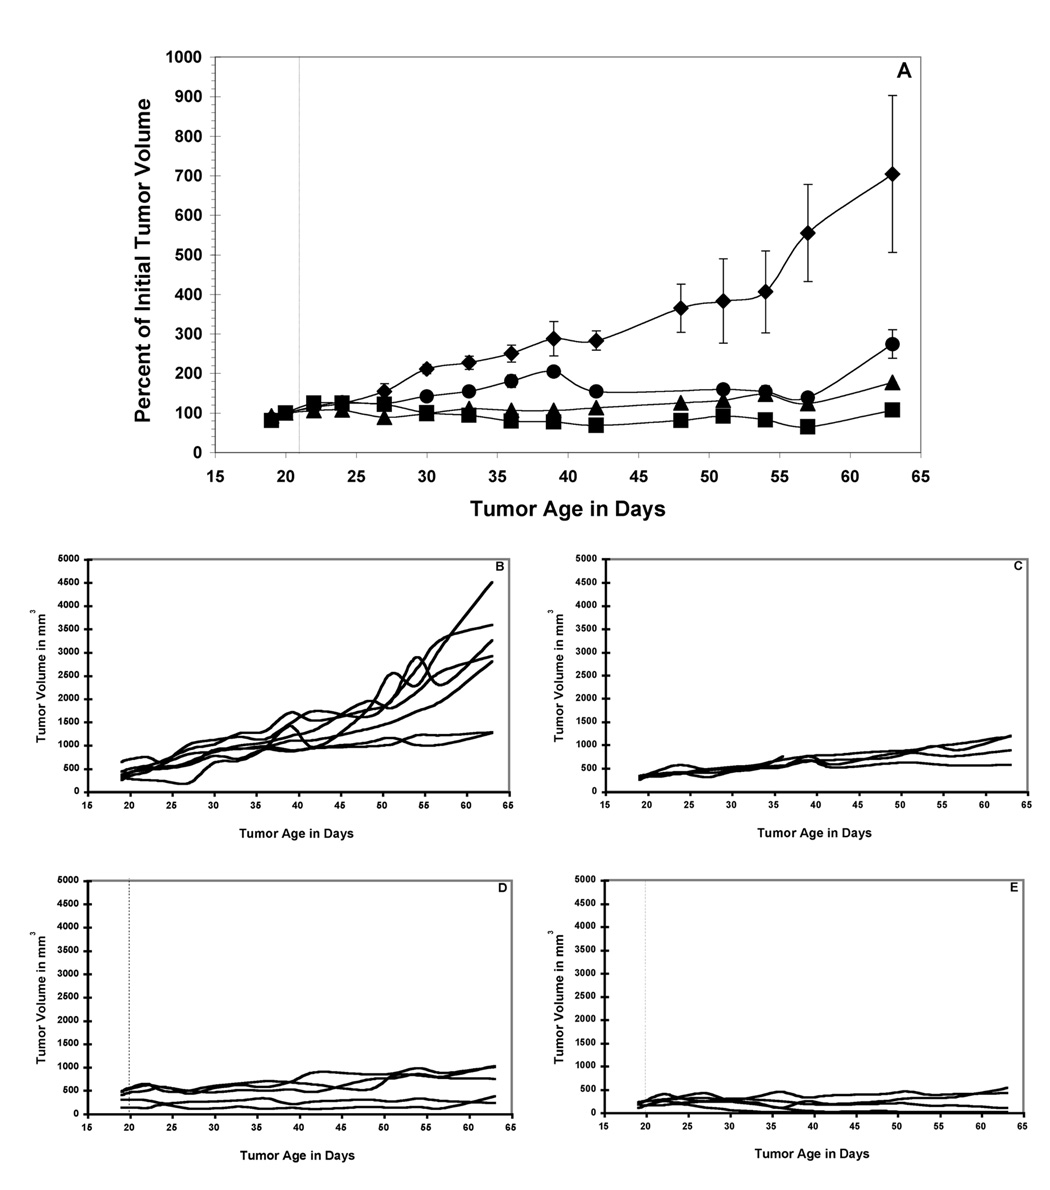
Figure 3.
211At-SAPS-C6.5 diabody RAIT of nude mice bearing established MDA-MB361/DYT2 human breast tumors. Mean values +/− SEM of cohorts of 5 mice treated with a single dose of 20 µCi (circles), 30 µCi (triangles) and 45 µCi (squares) of 211At-SAPS-C6.5 diabody and a cohort of 7 untreated mice (diamonds) are presented (A). Also shown are tumor volumes from individual mice from the control group (B), 20 µCi treatment group (C), 30 µCi (D) and 45 µCi (E). Significance between treatment and control groups are indicated as follows * = p < 0.05; ** = p < 0.01.

