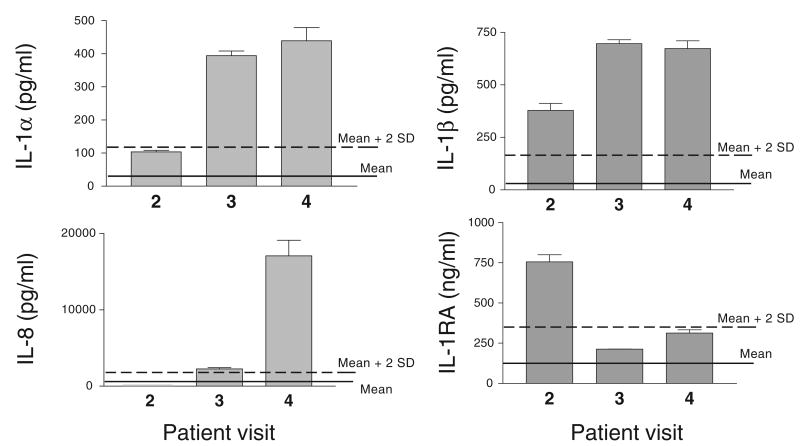
FIGURE 8.
Case interpretation: dynamic of cytokine concentrations in cervicovaginal lavages obtained from a sexually abstinent woman before microbicide product use (visit 2) and after microbicide product use (visits 2 and 3). Bars represent means ± SD of duplicate cytokine measurements by enzyme-linked immunosorbent assay. The solid line represents the average baseline cytokine level obtained for sexually abstinent women (n = 56), participating in two CONRAD-funded microbicide safety studies. The dashed line represents the mean plus 2 SD for these cohorts.

