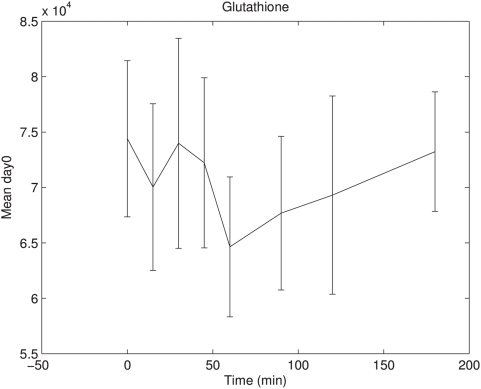
Figure 6. Day 0 glutathione response in OGTT time course.
Day 0 glutathione mean response with standard error is shown in OGTT time course for all subjects. Glutathione showed declined concentrations in the first part of the time course with a minimum concentration at 60 minutes after glucose intake. In the second part of the time course concentrations increase again.

