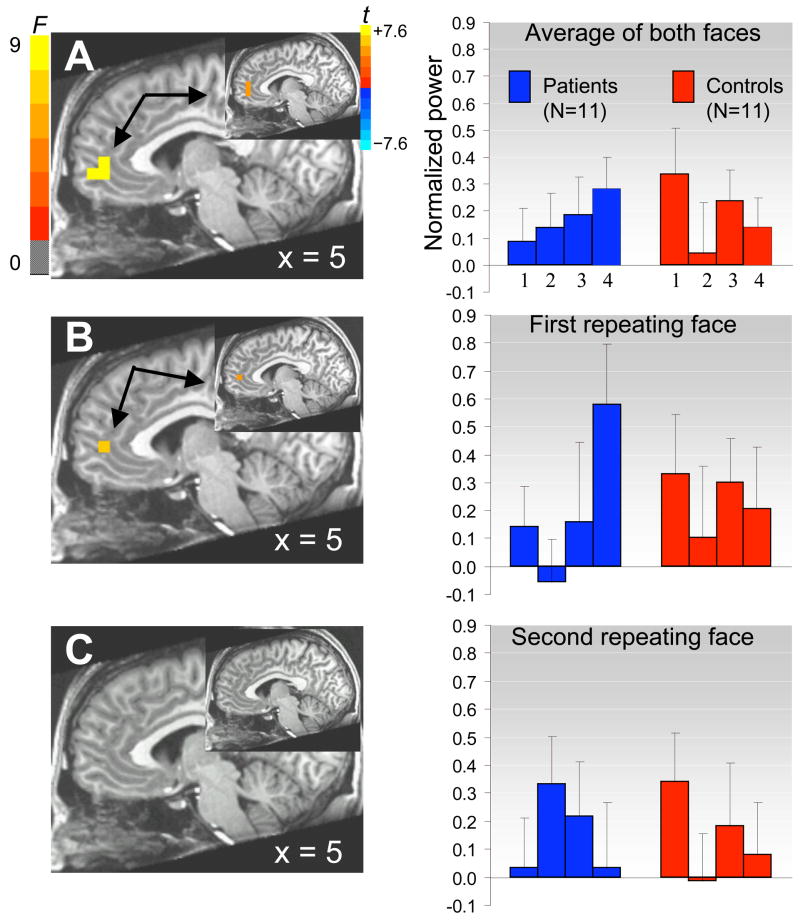
Figure 1.
ACC shows contrasting changes in activity (i.e., increasing or decreasing for 120 repeated presentations) in patients with MDD versus healthy controls for the average of both faces (A), and separately for the first face (B) but not the second face (C). Sagittal images show the omnibus F statistics for the 2 × 4 interaction between group and block (blocks 1,2,3,4) between 125–175ms post-stimulus onset (p < .001); insets show the t statistics for the linear contrast across blocks in the patient group (p < .002). Bar graphs show average power increase averaged across 125 voxels within an ACC region of interest (BA 24,32) as a function of group and blocks. Errors bars are standard errors of the means.

