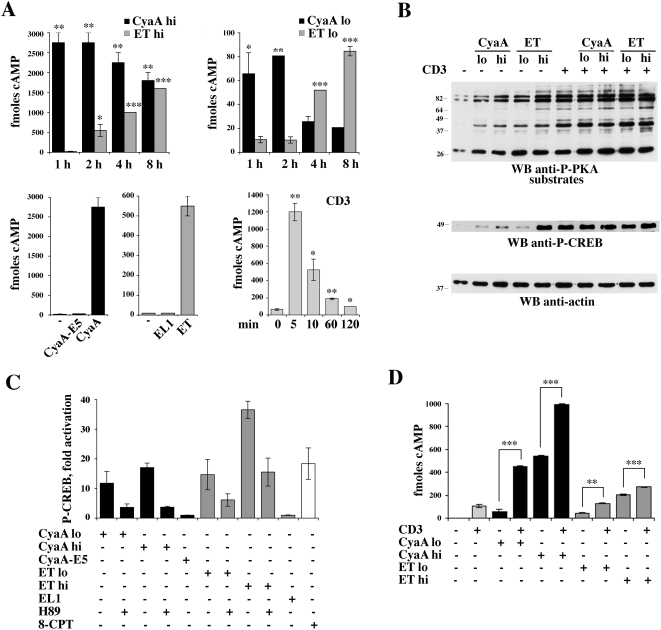
Figure 2. cAMP production and PKA activation in T cells treated with high and low concentrations of CyaA and ET.
(A) Time course analysis of cAMP production in purified peripheral blood T lymphocytes treated with high (CyaA hi, 45 nM ; ET hi, 110 nM) (top left) or low (CyaA lo, 0.28 nM; ET lo, 0.11 nM) (top right) concentrations of CyaA or ET, or activated by TCR/CD3 cross-linking (bottom right). The histogram on the bottom left panel also includes the quantification of cAMP in lysates of T cells treated with the adenylase cyclase deficient CyaA and ET mutants (45 nM CyaA-E5, 110 nM EL1) for 2 h or 6 h, respectively. The results, which show the levels of cAMP measured in T cell lysates, are expressed as fmoles/106 cells. Representative experiments, each carried out on duplicate samples from individual healthy donors, are shown (n≥4). (B) Top, Immunoblot analysis of the phosphorylation state of PKA substrates in post-nuclear supernatants of T cells treated with 45 nM CyaA (CyaA hi) or 0.28 nM CyaA (CyaA lo), or 110 nM ET (ET hi) or 0.11 nM ET (ET lo), for 2 h (CyaA) or 6 h (ET), and then lysed as such or after stimulation for 1 min with anti-CD3 mAb (CD3). A sample stimulated with anti-CD3 mAb alone was also included. The immunoblot was carried out using an antibody which recognizes a phosphorylated PKA consensus sequence (see Materials and Methods). The stripped filter was reprobed with a phosphospecific antibody which recognizes the active form of CREB (middle). The fold activation of CREB in CyaA/ET treated samples vs untreated control in the experiment shown was the following: CyaA low, 8.3; CyaA high, 19.0; ET low, 8.7; ET high, 79.9. The levels of phospho-CREB in the samples treated with CyaA or ET in combination with anti-CD3 mAb vs samples treated with anti-CD3 mAb alone (taken as 100%) were the following: CyaA low+CD3, 98.1±4.8%; CyaA high+CD3, 103.4±8.7%; ET low+CD3, 102.1±3.2%; ET high+CD3, 112.1±8.1% (n = 3). A control anti-actin blot is shown below. None of the treatments modified the expression levels of CREB (data not shown). Representative experiments are presented (n≥3). The migration of molecular mass markers is indicated. (C) Quantification of CREB phosphorylation in post-nuclear supernatants of T cells treated with 45 nM CyaA (CyaA hi)/CyaA-E5 or 0.28 nM CyaA (CyaA lo), or 110 nM ET (ET hi) /EL1 or 0.11 nM ET (ET lo), for 2 h (CyaA) or 6 h (ET). Where indicated, cells were pretreated for 1 h with 20 µM H89. A sample stimulated for 30 min with 100 µM 8-CPT was included as positive control. The data were obtained by laser densitometry of anti-phospho-CREB immunoblots. The results are expressed as relative CREB phosphorylation (fold activation vs untreated controls) (n = 2). (D) Quantification of cAMP in lysates of T cells treated as in B. The results, which show the levels of cAMP measured in T cell lysates, are expressed as fmoles/106 cells. A representative experiment, carried out on duplicate samples from an individual healthy donor, is shown (n = 3). ***P≤0.001; **P≤0.01; *P≤0.05. Error bars, SD.

