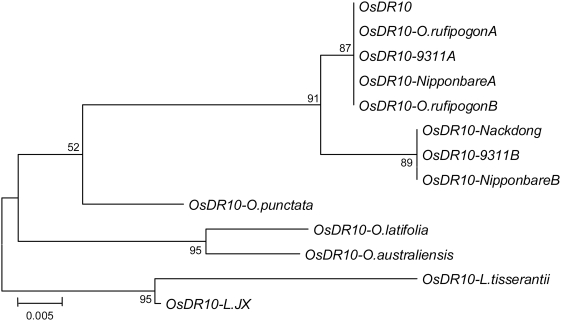
Figure 7. Phylogenetic analysis of the coding regions of OsDR10 and its homologs from different species.
The tree was constructed by the neighbor-joining method. The numbers for interior branches indicate the bootstrap values (%) for 1000 replications. The scale at the bottom is in units of number of nucleotide substitutions per site.

