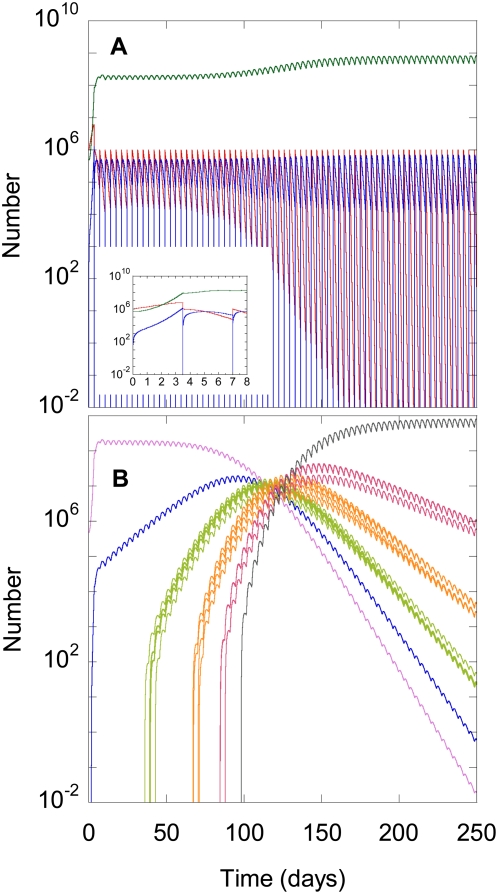
Figure 4. Model predictions of cell and viral dynamics.
The time evolution of (A) the number of uninfected cells (red), infected cells (blue), and infectious virions (green) and (B) homozygous virions carrying wild-type genomes (pink) and single (blue), double (green), triple (orange), quadruple (red), and quintuple (black) mutants, obtained by solving Eqs. (1)–(9) with the parameters T 0 = 106 cells, V 00 = 5×10⁵ virions, n = 5, l = 100 nucleotides, and εm from Figure 3 with E = 0. The remaining parameters are listed in Methods. The inset in (A) shows the evolution for the first two passages.

