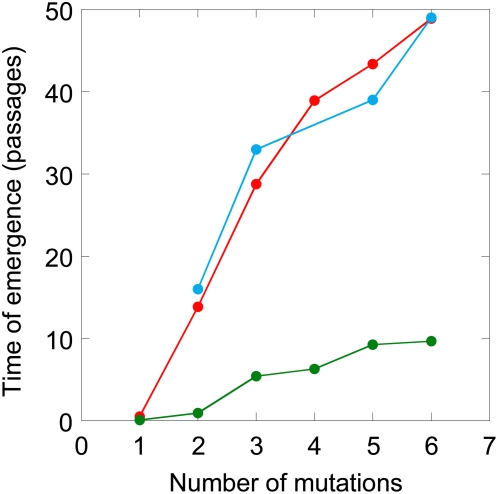
Figure 6. Comparison of model predictions (red) and the experimentally observed [10] (blue) times of emergence of different mutants resistant to tipranavir.
The different mutants and the corresponding IC 50 values are listed in Table S1. Also shown are the times when the numbers of the different mutant proviruses first reach 1 (green) predicted by our model when, following current models [34],[35], we assume that the waiting times wi = 0.

