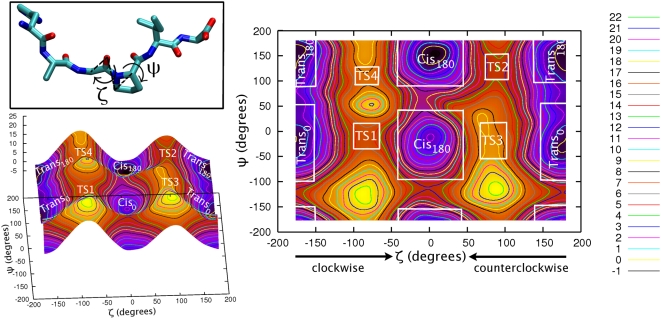
Figure 5. PEPT-CypA.
Free energy (kcal/mol) of the /HAGPIA/ bound to CypA as a function of the dihedral angles ζ and ψ (in degrees). The plot is divided in transition and minima regions (see Text S1 for details). Representative structures of each minima and TS conformation (center of the lower free energy cluster within each minima and TS region) in PDB format are given in Datasets S1, S2, S3, S4, S5, S6, S7, S8.

