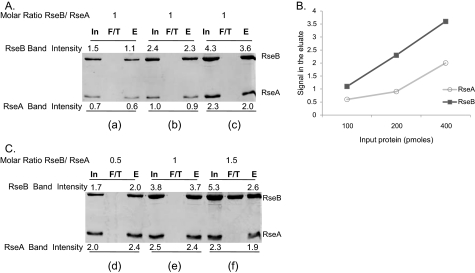
FIGURE 1.
SDS-PAGE analysis and quantification of in vitro binding of His-tagged RseA-peri to Flag-tagged RseB. RseA was immobilized on Ni-NTA resin and was allowed to interact with RseB (input, In). Unbound protein was collected as flow through (F/T) and bound proteins were eluted with imidazole (eluate, E) after washing. Input, flow through, and eluate samples were run on SDS-PAGE and quantified with ImageJ software. Band intensities measurements were made by integrating pixel densities in the band of interest and subtracting the contribution of the background. A, determining the linear range of the assay. For panel a, 100 pmol of RseA and RseB were loaded onto the column and for panels b and c, quantities of RseA and RseB were successively doubled keeping their molar ratio constant. B, standard curve for the binding assay shown in Fig. 1A. The plot shows the relationship between the protein loaded on the column as input and the band intensity for protein eluted from the column. C, determining the saturation of the assay. For panels d, e, and f, RseB was titrated against a fixed quantity of RseA (400 pmol). Band intensities of the proteins are indicated.

