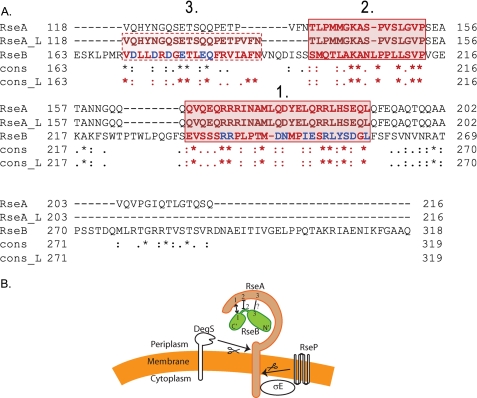
FIGURE 3.
Sequence analysis of RseA peri and RseB and a representation of regions of interactions. A, global and local sequence alignments of RseA-peri and RseB. The global and local sequence alignments were performed with the T-COFFEE and JAlign software packages, respectively. The periplasmic domain aligned to a specific region (170-289) of RseB. The global alignment is represented by sequences RseA and RseB, while the local alignment is represented by RseA_L and RseB. The degree of conservation for each aligned pair of residues between RseA and RseB and between RseA_L and RseB is indicated below the aligned pair: asterisk, denotes exact match; colon, conserved substitutions; dot, semi-conserved substitutions, and blank indicates that there is no match between the residues. While the overall sequence identity is only 14%, the alignment has revealed two sequence motif regions that are common for both proteins and are exactly the same in both alignments (red solid box, regions 1 and 2). Moreover, using the local alignment, we were able to identify another region with six conserved residues, that was recovered only partially when using global alignment (red dotted box, region 3). The alanine substitutions made in RseB during the course of this study are marked in blue. B, schematic representation summarizing our results of the interactions between RseA and RseB. N′ and C′ refer to N-terminal and C-terminal domains of RseB. We provide evidence that similarity region 1 of RseA and RseB interact and that similarity region 2 of RseA and RseB neither affect binding of the two proteins to each other nor interact. Altering similarity region 3 of RseB decreases binding to RseA but we do not know whether these two similarity regions interact.

