FIGURE 2.
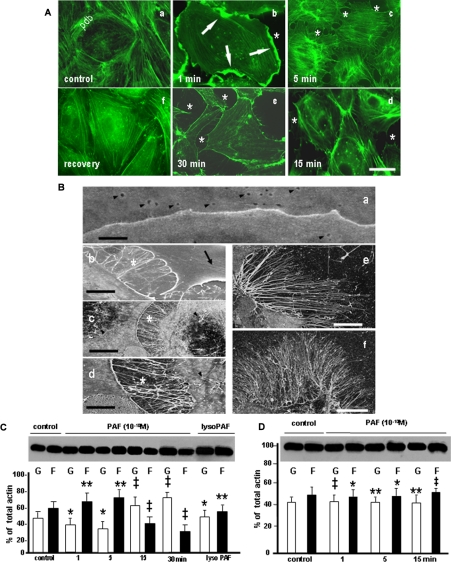
PAF-induced structural and biochemical alterations of endothelial actin pools. A, phalloidin staining of endothelial actin in control conditions and after PAF-R activation. Actin staining of growth hormone-starved monolayers (control) showed the presence of a well organized peripheral dense band (PDB) and the existence of a few stress fibers (SF) scattered in the center of the cell. When confluent monolayers of HUVECs were stimulated with PAF for 1 min, 5 min, 15 min, and 30 min (e), we observed the formation of large cellular folds in the first 1 min (b, arrows), the dilation of IEJs (asterisk in b-e), the dissolution of PDB (c-e), and the formation of SF in the first 5 min (b and c). These alterations were less numerous at the later time points (d and e). The mentioned changes of endothelial cell shape and of endothelial actin pools are PAF-R-dependent, since the treatment of the monolayer with BN 52078 prevented them (e). Bar, 30 μm in a, b, e, and f and 25 μm in c and d (n = 8). B, high resolution field emission scanning EM of PAF-induced alterations in endothelial cells. a, the IEJ between two resting ECs appears as a continuous line without interruptions or irregularities. The figure also illustrates the presence of plasmalemmal openings of endothelial vesicular carriers on both cells (arrowheads). Bar, 0.1 μm (n = 6). b, IEJ gaps formed between endothelial cells that are filled with filopodia and lamellipodia (asterisk). The wrinkles present on the surface of one of the endothelial cells (arrow) represent plasma membrane folds over the newly formed SF inside the cell. Bar, 1 μm (n = 6). c, within 5 min of PAF exposure, there is a marked increase in membrane projections (especially filopodia), and the newly formed filopodia are also found on the surface of PAF-treated cells (arrowheads). Bar, 5 μm (n = 6). d, by 15 min after PAF exposure, membrane projections remained abundant, whereas the dimensions (width and length) of IEJs gaps increased. Bar, 2 μm (n = 6). e and f, the number and length of the filopodia were maximal by 30 min. Bar, 5 μm for e and 10 μm for f (n = 6 in both cases). C and D, PAF-R activation induced the shift of G- to F-actin. C, different pools of actin from confluent monolayers of HUVECs were analyzed by immunoblotting with an anti-actin polyclonal Ab. The panel illustrates changes in G- and F-actin pools in control and PAF-treated (10-10 m) monolayers. Note the changes in G- and F-actin from basal conditions (control) to more F-actin in the first 5 min and the reversal of the ratio (with much more G-actin) at 15 and 30 min. The last lanes show that lyso-PAF (10-6 m for 30 min) did not change the ratio of different pools of actin (n = 8). D, the blot shown illustrates the absence of actin pool changes induced by PAF challenge following pretreatment of monolayers with the PAF-R antagonist BN 52078 (n = 6). Statistical significance was as follows: *, p < 0.01; **, p < 0.05; ‡, p < 0.001, by comparison with controls (Student's t test).

