FIGURE 6.
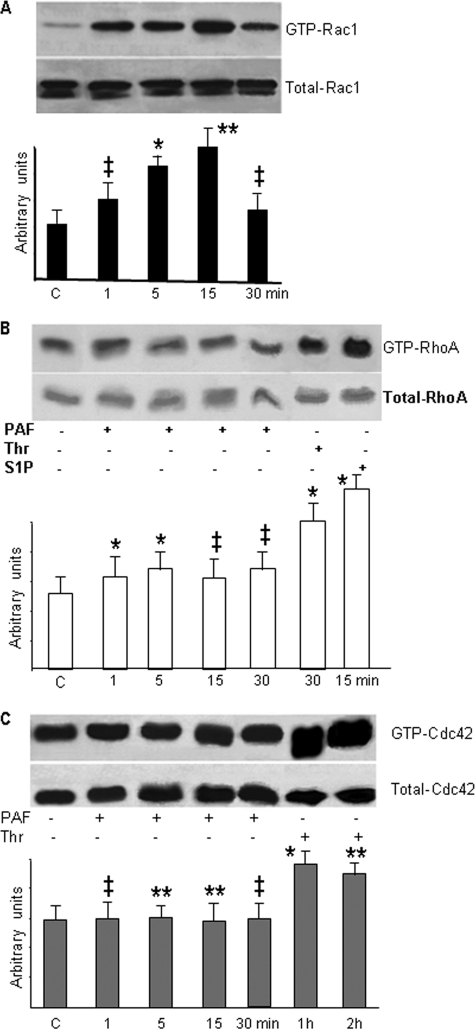
PAF selectively activates Rho GTPase Rac1. A, Rac1 is the only small GTPase activated. Western blot shown in the upper panel demonstrates the activation of Rac1 after PAF treatment, whereas the lower panel shows that the total amount of Rac1 is not modified (n = 10). Note that Rac1 activation returns to basal level by 30 min. Quantitative measurements are shown in the associated bar graph. B, RhoA was not activated, as shown by the Western blot from the upper panel. The lower panel illustrates that the total amount of RhoA present in the monolayers did not change. Summary data from different experiments are presented in the bar graph (n = 5). Note the changes in the status of RhoA after thrombin (10 IU, 30 min), its bigger activation after sphingosine 1-phosphate (5 μm, 15 min), and its unchanged status after PAF. C, Cdc42 was also not activated at any time point after PAF challenge (n = 5), and the total levels remained relatively unchanged, as shown in the lower panel. The summary bar graph represents studies in confluent monolayers. Statistical significance for A-C is as follows: *, p < 0.01; **, p < 0.05; ‡, p < 0.001 (paired Student's t test).

