FIGURE 8.
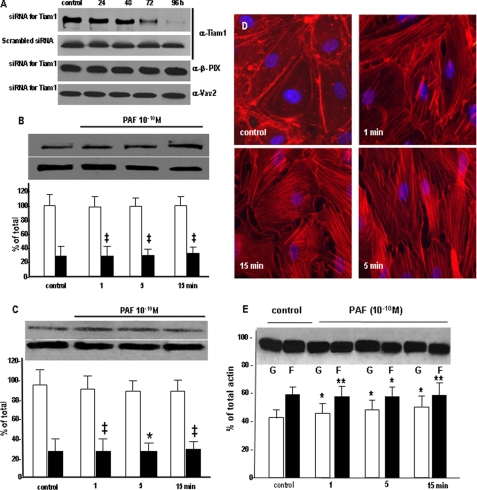
Effects of Tiam1 down-regulation on PAF-induced signaling. A, Tiam1 down-regulation. HUVECs treated with siRNA specific for Tiam1 showed a gradual decrease in the total amount of protein starting at 48 h, with a >80% reduction seen at 96 h, as demonstrated by Western blotting of EC lysate probed with anti-Tiam1 Ab. Note that the scrambled sequence of the specific siRNA did not change the levels of Tiam1 at any time point. The specific siRNA sequence did not affect the expression of β-Pix and Vav2 Rac1 GEFs, as shown in the bottom two panels (n = 6). B, Tiam1 down-regulation effects on Rac1 redistribution. The top panels shows that there is no modification in the amount of Rac1 in the membrane fraction (upper panel) as well as in its total amount (lower panel), whereas the associated graph quantitatively substantiates the lack of Rac1 redistribution at 96 h after Tim1 knockdown; compare with Fig. 7A (n = 7). Statistical significance was as follows: ‡, p < 0.001 (paired Student's t test). C, Rac1 activation is affected by Tiam1. The activation of Rac1 as detected by the pull-down assay is drastically impaired when Tiam1 is down-regulated and the monolayers are stimulated with PAF, as illustrated in the upper panel. However, the total amount of Rac1 is not affected under the same conditions as shown in the lower panel (n = 6). Statistical significance was as follows: *, p < 0.01; ‡, p < 0.001 (paired Student's t test). D, Tiam1 knockdown effect on interendothelial gaps. When the distribution of endothelial actin assessed by staining with fluorescein isothiocyanate-phalloidin was investigated after Tiam1 down-regulation, we did not found it, under basal conditions, changed (compare with the control panel from Fig. 2A, a). b-d show the distribution of cellular actin in monolayers of HUVEC after Tiam1 depletion and exposure to PAF for different periods of time (n = 4). Under these conditions, there is a redistribution of actin toward a polymerized status; however, note the dramatic reduction in the number of inter endothelial gaps, filopodia, and lamellipodia (compare with Fig. 2, a-e)(n = 8). Bar, 22 μm. E, Tiam1 affects the actin shift. The Western blot shows inhibition of actin shift after Tiam1 down-regulation. Challenging the Tiam1-depeleted monolayers with PAF prevented the G- to F-actin shift (compare with Fig. 2C)(n = 4). Statistical significance was as follows: *, p < 0.01; **, p < 0.05, by comparison with controls (Student's t test).

