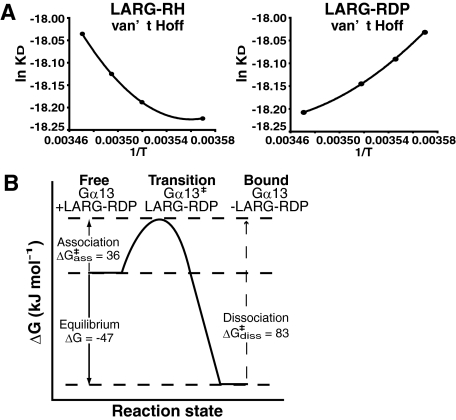
FIGURE 4.
Thermodynamic analysis of Gα13-LARG interaction. A, thermodynamic analysis of the Gα13-LARG complex formation and dissociation through its RH and DH domain. van't Hoff plots and Eyring plots of the experimental data are shown. The thermodynamic parameters at an equilibrium state and at a transition state were estimated from van't Hoff plots and Eyring plots as described under “Experimental Procedures” (Table 2 and supplemental Fig. S3). B, schematic reaction profile of the thermodynamic energies at the different states of Gα13-LARG interaction.

