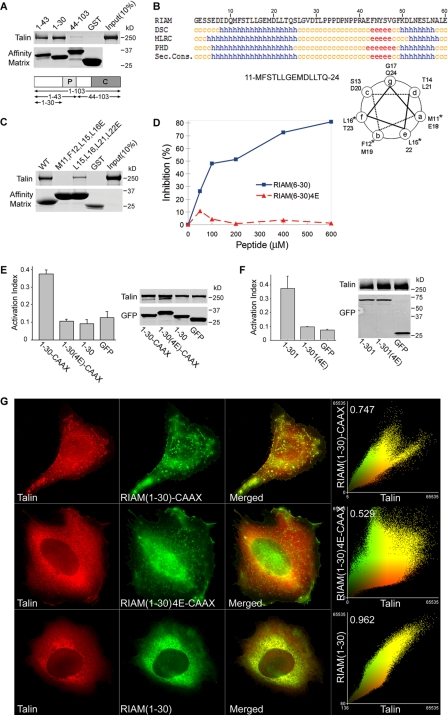
FIGURE 5.
A minimized Rap-RIAM module is sufficient for integrin activation. A, minimal talin binding sequence of RIAM is in the N-terminal 30 residues. Purified His6-talin was incubated with GST-RIAM-(1–103), -(1–43), or -(1–30) or GST immobilized on glutathione-Sepharose. Bound proteins were fractionated by SDS-PAGE and analyzed by Coomassie staining. B, talin binding fragment of RIAM-(1–30) contains a putative amphipathicα-helix. RIAM-(1–30) was analyzed using a secondary structure prediction program (PBIL) and predicted helical residues (h) were identified with DSC, MLRC, and PHD programs. Symbols represent α-helix (h), random coil (c), and extended strand (e). Sec. Cons., secondary consensus residues. Helical wheel analysis was performed on RIAM-(11–24) containing the predicted α-helical region, and the asterisk denotes hydrophobic amino acid residues that were mutated to charged Glu residues (see Fig. 5C). C, disruption of hydrophobic face of the predicted helix abolishes talin binding. Hydrophobic amino acid residues aligned along one side of the predicted amphipathic α-helix in RIAM-(1–30) were mutated to glutamic acids and expressed as GST-tagged proteins immobilized on glutathione-Sepharose beads. Purified recombinant His6-talin was incubated with GST-RIAM-(1–30) and the corresponding mutants M11E,F12E,L15E,L16E (RIAM-(6–30)-4E) or L15E,L16E,L21E,L22E. Bound proteins were fractionated by SDS-PAGE followed by Coomassie Blue staining for detection. D, interaction of RIAM with talin is inhibited by a short RIAM wild type peptide but not by mutant peptide. The complex of GST-RIAM-(1–301) was incubated with full-length recombinant talin, and binding was performed as described in Fig. 1B in the presence of increasing amounts of peptides containing sequences from RIAM; that is, wild type peptides spanning (6–30) or a mutant peptide (6–30)-4E. 4E denotes the M11E,F12E,L15E,L16E mutant. Bound talin was quantified by densitometry of Coomassie Blue-stained bands, and percent inhibition was calculated as 100 × (B0 - B)/B0, where B0 = binding in the absence of peptide, and B = binding in the presence of peptide. E, Rap1 membrane targeting sequence fused to RIAM-(1–30) induce integrin activation that is abrogated by mutations that abolish talin binding. A5 cells expressing HA-talin in combination with the indicated GFP-RIAM-(1–30) proteins or GFP control were assessed for PAC1 binding using flow cytometry to measure activation of αIIbβ3 (data are the mean ± S.E. of independent experiments; n ≥ 3). Transfected protein expression was verified by Western blotting. F, mutations that perturb talin binding abolishes integrin activation induced by RIAM-(1–301). A5 cells expressing HA-talin and GFP-tagged RIAM-(1–301), RIAM-(1–301)-4E. or GFP vector control were assessed for their ability to bind PAC1 using flow cytometry (data are the mean ± S.E. of independent experiments; n ≥ 3). 4E denotes the M11E,F12E,L15E,L16E mutant. Transfected protein expression was assessed by Western blotting. G, RIAM-(1–30)-CAAX recruits talin to clusters at the membrane. A5 cells expressing mCherry-talin and GFP-tagged RIAM-(1–30)-CAAX, RIAM-(1–30)-4E-CAAX, or RIAM-(1–30) were adhered to fibrinogen-coated coverslips and imaged to show talin (red) and RIAM (green). Epifluorescent images as shown are maximal projections of deconvoluted 0.1-μm z-section images of the entire cell volume. The right panels show a two-color component scatter plot comparing the distribution of correlated pixels for the indicated labeled proteins and the calculated Pearson's correlation coefficient.

