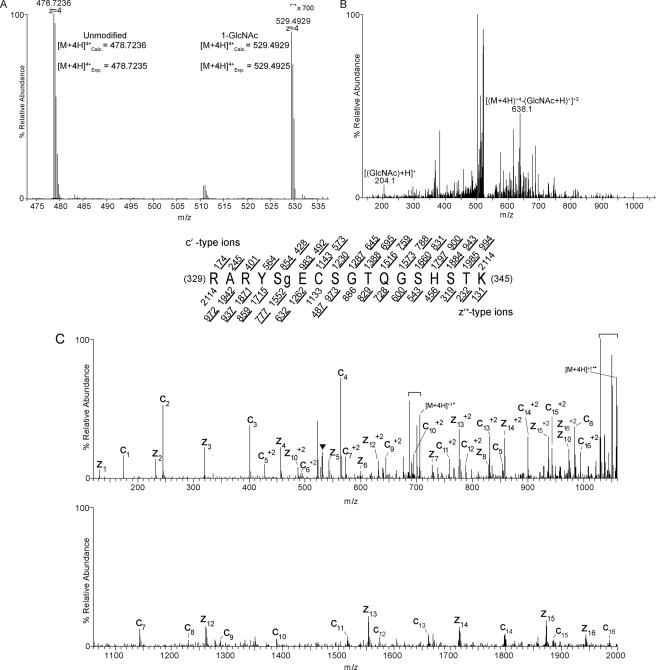
FIGURE 1.
O-GlcNAc site mapping on Pgc-1α via liquid chromatography-MS/MS. A, a high resolution MS1 spectrum (mass range m/z 473–537) recorded using a LTQ Orbitrap mass spectrometer operated in the data-dependent mode. The [M+4H]+4 ion at m/z 478.7236 corresponds to the 12C isotope of the LysC-generated, carbamidomethylated PGC-1α peptide, RARYSECSGTQGSHSTK. This mass agrees to <1 ppm with the calculated monoisotopic mass. Signals at m/z 529.4929 correspond to the [M+4H]+412C isotope of RARYSECSGTQGSHSTK harboring one GlcNAc moiety; this mass agrees with the calculated mass to <1 ppm. Signals for the GlcNAcylated species are >700-fold lower in abundance relative to the unmodified species. B, a CAD MS/MS spectrum recorded on [M+4H]+4 ions (m/z 529.4) of GlcNAcylated peptide RARYSECSGTQGSHSTK. The CAD spectrum contains signature GlcNAc oxonium ions at m/z 204.1 that are generated from loss of the GlcNAc moiety upon collision-activated dissociation (56). Charge-reduced ions, [(M + 4H)+4-(GlcNAc +H)+1]+3 at m/z 638.1, are also observed in this spectrum (56). C, an ETD MS/MS spectrum recorded on [M+4H]+4 ions (m/z 529.8) of GlcNAcylated peptide RARYSECSGTQGSHSTK. An ETD-enabled LTQ mass spectrometer was operated to record a MS/MS spectrum on m/z 529.8 followed by four data-dependent scans after every MS1 scan to generate the ETD spectrum, which is presented as a subtracted spectrum. Predicted product ions of types c′- and z′·- are listed above and below the peptide sequence, respectively. Singly and doubly charged ions are listed as monoisotopic and average masses, respectively. Observed product ions are underlined and are sufficient to define the O-GlcNAc residue at Ser-333. ETD product ions are labeled in the ETD spectrum. A triangle (▾) is positioned above m/z peaks that are within the precursor isolation window. Signals corresponding to charge-reduced species and species resulting from neutral losses are bracketed.

