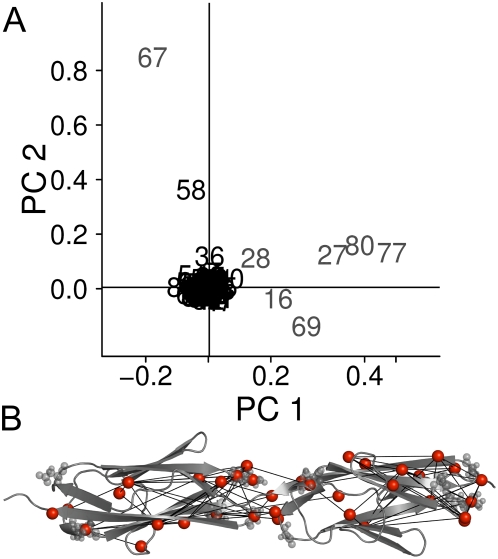
Figure 3. Coevolved interaction interface.
(A) Principal component analysis on the perturbation matrix (see Methods) separates a set of residues along the first component (gray numbers). (B) Mapping these residues on the adjacent titin domains I67 and I68 (PDB-Code 2RIK [30]) reveals that they apparently belong to a conserved IG-IG interaction interface. Interaction interface residues are marked as gray spheres. Edges connect highly coevolved residues (red spheres) with ΔΔE>0.7.

