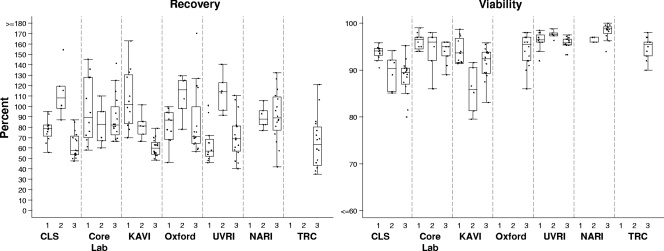
FIG. 1.
Recovery and viability of thawed rested PBMC at participating laboratories in each proficiency panel. The recovery is indicated as the percentage of viable thawed cells recovered relative to the number of viable cells frozen. PBMC were cryopreserved in aliquots of 10 million; thus, the recovery of 6 million viable PBMC would be 60% recovery. The viability of the total PBMC fraction following thawing and resting is indicated. Each point represents a single thawed sample. Boxes represent the interquartile ranges, and horizontal lines within the boxes represent the medians. Vertical bars extend to the largest observed value within 1.5 times the interquartile range. Laboratories listed on the x axes are identified in Materials and Methods.

