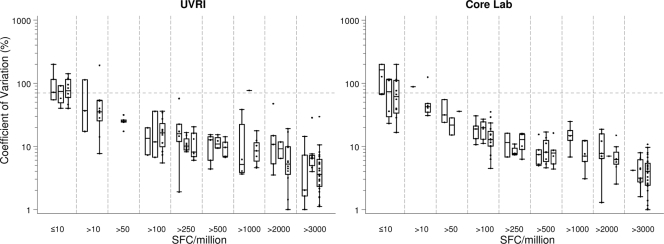
FIG. 3.
The CV between replicate wells for two of the laboratories that participated in all three panels are shown, in relation to grouped ELISPOT SFC counts for CEF and CMV peptides and PHA. The dotted line represents a CV of 70%. Counts were determined by subtracting background values and are presented per 106 PBMC. Within each subgroup, there are up to three box plots, representing panels 1 to 3, respectively.

