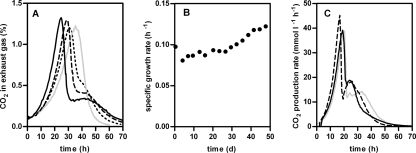
FIG. 3.
(A and B) CO2 production profiles (A) and estimated μmax derived from CO2 production (B) during repeated anaerobic batch cultivation in MY-XA. Gray line, batch 2; dotted line, batch 7; dashed line, batch 12; solid black line, batch 16. (C) CO2 production profiles during anaerobic batch cultivation in MY containing 30 g liter−1 glucose, 15 g liter−1 d-xylose, and 15 g liter−1 l-arabinose inoculated with a 100-ml sample taken from the repeated batch cultivation (solid black line) compared to strain IMS0003 (solid gray line) and single-colony isolate IMS0007 (dashed line). To correct for small differences in the initial biomass, the profiles were aligned using the beginning of the glucose consumption peak.

