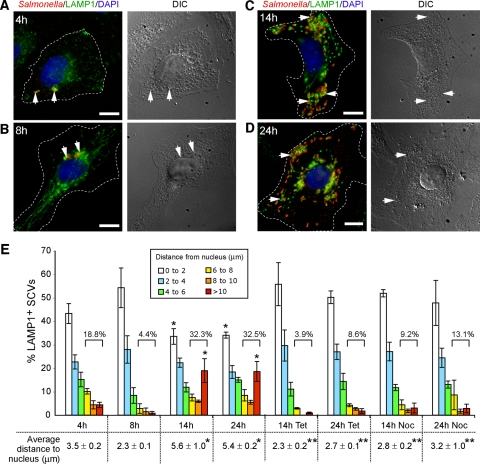
FIG. 1.
SCVs exhibit dynamic intracellular positioning over the course of infection. (A to D) HeLa cells were infected with WT serovar Typhimurium and fixed at the indicated times postinfection. Cells were immunostained for bacteria (red) and LAMP1 (green), and the nucleus was stained using DAPI (blue). The left panel shows immunofluorescence images, with dotted lines indicating cell borders; the right panel shows corresponding differential interference contrast (DIC) images. Arrows indicate LAMP1+ SCVs. Bar, 10 μm. (E) Distribution of SCVs in HeLa cells relative to the host cell nucleus over time. Cells were fixed at the selected time points postinfection and immunostained as above. The distances of LAMP1+ SCVs to the nearest edge of the host cell nucleus were measured and grouped according to the specific distances shown in the histogram. Numbers above the square brackets indicate total percentage of SCVs that are located >6 μm from the host cell nucleus. Shown at the bottom of the histogram are the average distances ± standard deviations for three separate experiments, calculated as outlined in the Materials and Methods. Where indicated, nocodazole (2 μg/ml) or tetracycline (20 μg/ml) was added at 8 hpi. At least 100 LAMP1+ SCVs were measured from the nucleus for each time point in a given experiment. *, P < 0.001) in comparison to the corresponding 8-hpi measurement; ** P < 0.001 in the average distances of SCVs to the nucleus between the drug-treated cells and the corresponding WT control time points, as determined by Kruskal-Wallis one-way ANOVA with Dunn's multiple comparison posttest.

