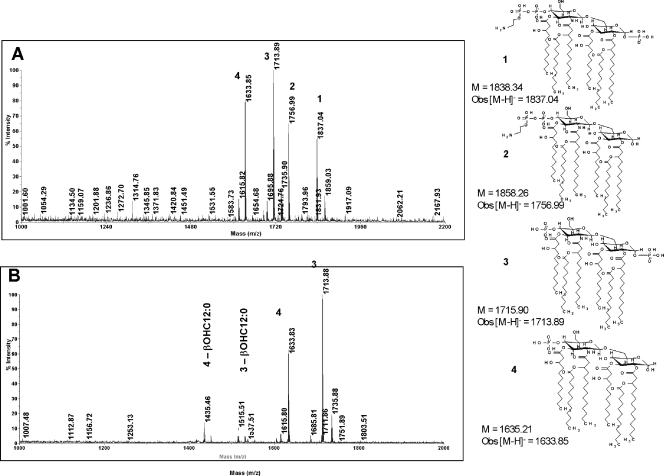
FIG. 5.
MALDI-TOF MS spectra for gonococcal lipid A. Shown are the data for the lipid A from parent strain FA19 (A) and transformant strain FA19 lptA::spc (B). The lipid A structures that are consistent with the [M-H]− ions observed in the MALDI-TOF MS spectra are also shown in this figure. The calculated molecular weights for the structures (M) are given along with the observed [M-H]− ion for the lipid A from FA19 (wt); the single-digit numbers above ion peaks refer to structures shown to the right of panels A and B. Obs, observed.

