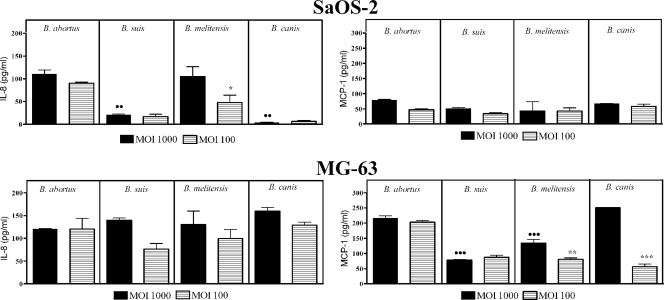
FIG. 5.
Chemokine production by osteoblasts infected with different Brucella species at MOIs of 100 and 1,000. Levels measured at 48 h p.i. are depicted. Values represent specific chemokine production (spontaneous chemokine release by noninfected cells has been subtracted) and are expressed as means ± SEM of duplicate determinations in a representative experiment of two with similar results. Differences were analyzed by ANOVA followed by Tukey's multiple comparison test. Significant differences between B. abortus and other species at an MOI of 1,000 are shown with closed circles (••, P < 0.01; •••, P < 0.001). Significant differences between MOIs of 100 and 1,000 for the same species are shown with asterisks (*, P < 0.05; **, P < 0.01; ***, P < 0.001).

