FIG. 1.
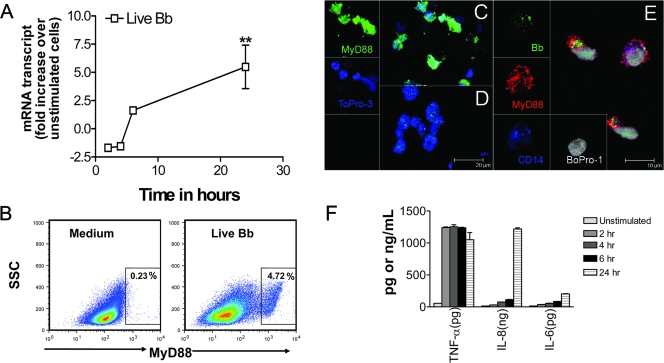
Live B. burgdorferi spirochetes (MOI of 10) activate MyD88 expression in THP-1 cells. Vitamin D3-treated THP-1 cells (3 × 10⁶ cells/ml) were incubated in supplemented antibiotic-free RPMI medium alone or with live B. burgdorferi (Bb). (A) RNA samples were collected after 2, 4, 6, and 24 h of incubation, and the MYD88 transcripts were quantified by qRT-PCR. All values were normalized with respect to the GAPDH “housekeeping” gene mRNA levels. Results are presented as the fold increase over control (the level in unstimulated cells). Each line symbol represents the means ± standard deviations (SDs) of three independent experiments. Asterisks indicate significant upregulation (P < 0.01). (B) THP-1 cells (0.5 × 10⁶) incubated with live B. burgdorferi for 24 h and then fixed and stained with anti-MyD88 antibody and Alexa-488-labeled secondary antibody and subjected to flow cytometric analysis revealed upregulation of MyD88 expression in cells compared with that in the medium control cells. Numbers in the insets are percentages of MyD88-positive cells. (C and D) After 24 h of stimulation with live B. burgdorferi, cells were fixed and stained with anti-MyD88 antibody and Alexa-488-labeled secondary antibody (green), and nuclei were counterstained with ToPro3 (blue). Both stimulated (C) and unstimulated (D) cells were visualized by confocal fluorescence microscopy. (E) Cells were fixed and triple stained with anti-MyD88 antibody and Alexa-568-labeled secondary antibody (red), fluorescein isothiocyanate-labeled anti-B. burgdorferi antibody (green), and anti-CD14 antibody and Alexa-633-labeled secondary antibody (blue); nuclei were counterstained with BoPro-1 (gray) and were visualized by confocal fluorescence microscopy. (F) Cell-free supernatants were harvested from the culture medium at 2, 4, 6, and 24 h and analyzed by antibody capture ELISA for TNF-α, IL-8, and IL-6 production. The lower limit of detection of the ELISA was 15 pg/ml. Each bar represents the means ± SDs of three independent experiments.

