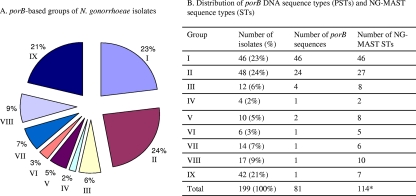
FIG. 1.
porB-based groups and distributions of PSTs and NG-MAST STs of 199 N. gonorrhoeae isolates. (A) porB-based groups. (B) Distribution of porB PSTs and NG-MAST STs. Isolates were grouped based on the number of isolates with identical porB PSTs. For group I, each isolate has a distinct PST (n = 46). For group II, each two isolates have an identical PST (n = 48). For group III, each three isolates have an identical PST (n = 12). For group IV, four isolates have an identical PST. For group V, each five isolates have an identical PST (n = 10). For group VI, six isolates have an identical PST. For group VII, 14 isolates have an identical PST. For group VIII, 17 isolates have an identical PST. For group IX, 42 isolates have an identical PST. Percentages represent the proportions of total isolates. *, some NG-MAST STs were further differentiated by porB typing.

