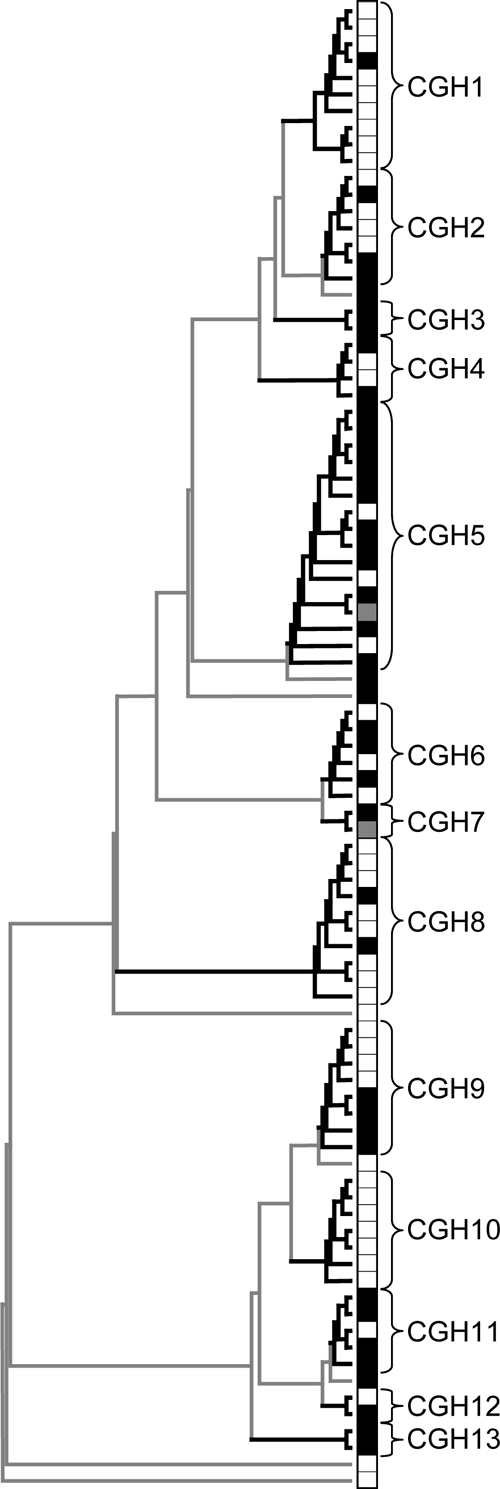
FIG. 4.

Global clustering dendrogram of feedlot cattle and human clinical C. jejuni isolates. Heavy black lines indicate greater than 75% bootstrap support. The figure includes 87 field isolate arrays (white squares indicate bovine isolates, and black squares indicate human isolates) and two laboratory strain arrays (gray squares).
