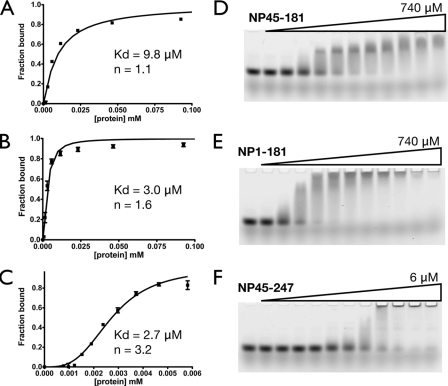
FIG. 3.
Effects of the ID regions (residues 1 to 44 and 182 to 247) on the RNA binding affinity of the NTD. (A through C) Fitting of the binding isotherms of NP45-181 (NTD) (A), NP1-181 (B), and NP45-247 (C), based on the EMSA results. Each binding isotherm represents the overall fitting against three independent experiments, taking into account the standard deviation of each data point. (D through F) Representative EMSA results for NP45-181 (D), NP1-181 (E), and NP45-247 (F).

