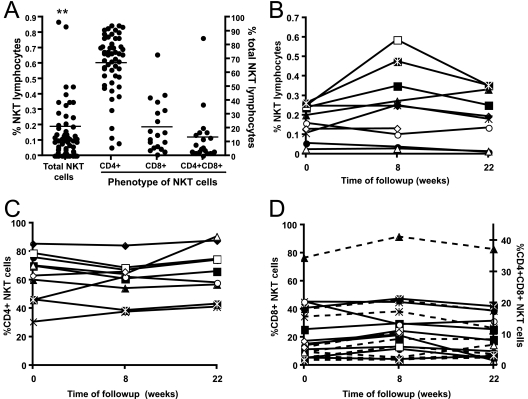
FIG. 2.
Levels of NKT cells in naïve pigtail macaques. (A) Levels of CD1d tetramer-positive NKT cells from 64 macaques are shown in the left dot plot. The two asterisks reflect two macaques with levels of 1 to 2%. The line represents the mean. The proportions of CD4+ CD8−, CD8+ CD4−, and CD4+ CD8+ NKT cells are shown in the three right-hand dot plots, expressed as a percentage of total NKT cells. (B, C, and D) Proportions of total, CD4+ CD8−, CD8+ CD4−, and CD4+ CD8+ (dotted lines) NKT cells over time in naïve macaques.

