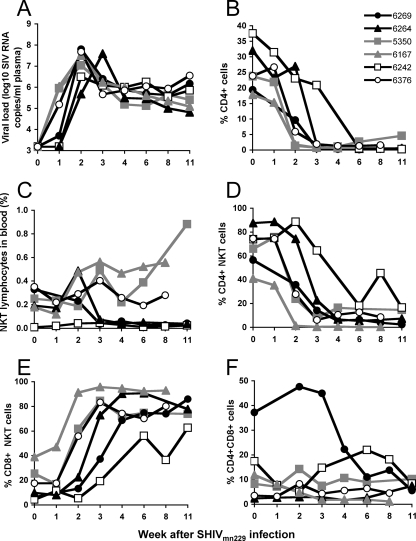
FIG. 3.
NKT cells following X4-tropic SHIV infection. (A and B) Viral load (A) and total peripheral CD4 T cells (B) following SHIVmn229 infection of six pigtail macaques. Animal identification numbers are shown in the legend. (C) Levels of total NKT cells over time after infection. Data for animals with total NKT cell depletion are shown as black closed symbols, and those with increased numbers of NKT cells are shown as gray symbols. (D, E, and F) Proportions of CD4+ CD8−, CD8+ CD4−, and CD4+ CD8+ NKT cells after infection.

