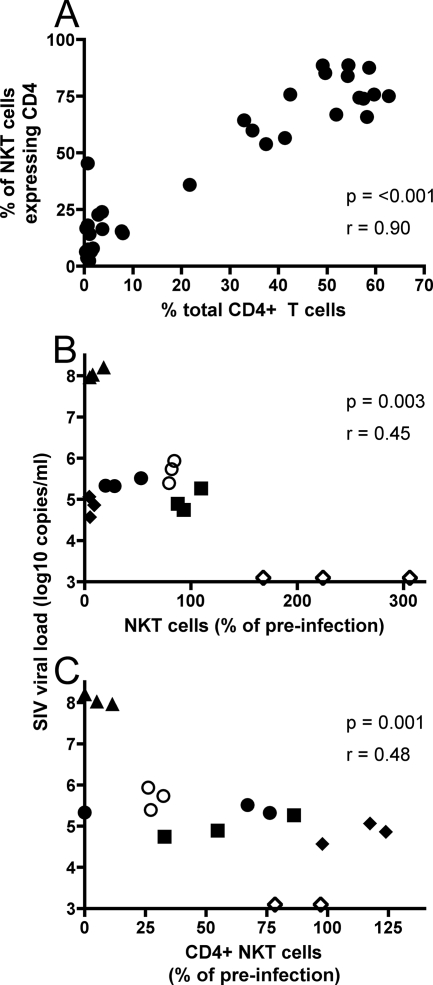
FIG. 5.
Relationship between CD4 depletion, viral load, and NKT cell levels. (A) Correlation between depletion of total CD4 T cells (expressed as a proportion of total lymphocytes) and CD4+ CD8− NKT cells (expressed as a proportion of baseline levels) following SHIVmn229 infection. Dots represent all values from the six animals shown in Fig. 3B and D. (B) Correlation between SIV viral load and total NKT cells (expressed as a proportion of the baseline) following SIVmac251 infection. (C) Correlation between SIV viral load and CD4+ CD8− NKT cells (expressed as a proportion of baseline) following SIVmac251 infection. Dot symbols (B and C) represent the last three measurements during chronic infection for each individual animal.

