FIG. 8.
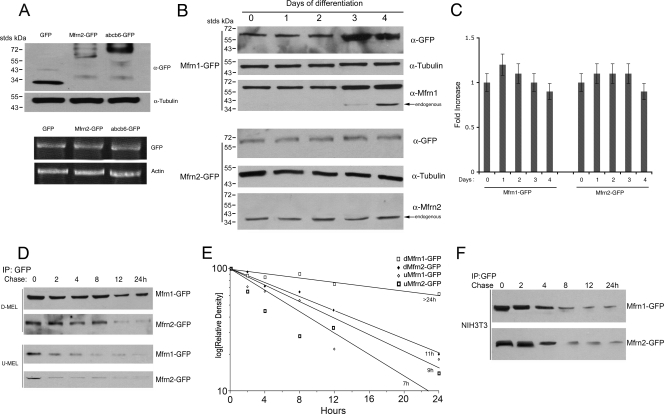
Mfrn1 and Mfrn2 protein levels are differentially regulated. (A) NIH 3T3 fibroblasts were transfected with empty vector (GFP), Mfrn2-GFP, or Abcb6-GFP. The cells were grown for 24 h, and the cell lysates were run on 4 to 20% acrylamide gel and probed using anti-GFP and antitubulin antibody. The cells were lysed, and RT-PCR was performed using primers for GFP and actin. (B) MEL cells were transfected with Mfrn1-GFP or Mfrn2-GFP and differentiated for 4 days. The cell lysates during differentiation were probed using anti-GFP, anti-Mfrn1, anti-Mfrn2, or anti-α-tubulin antibody. (C) MEL cells treated as described for panel B were lysed, and quantitative RT-PCR was performed using GFP and actin primers. The data were normalized to actin and expressed as the increase compared to the level at time zero during MEL cell differentiation. (D) MEL cells were transfected with Mfrn1-GFP or Mfrn2-GFP and differentiated for 4 days. After 4 days of differentiation, the cells were pulse-chased using 35S-labeled methionine. The cells were lysed at different time points and were immunoprecipitated (IP) using GFP antibody. A representative gel is shown in panel D, and the quantification of the bands plotted as the relative density compared to that at time zero for three independent experiments is shown in panel E. The estimated half-lives are included in the figure. (F) NIH 3T3 cells were transfected with Mfrn1-GFP or Mfrn2-GFP, limited for methionine, and pulse-chased using 35S-labeled methionine. The cells were lysed at different time points and were immunoprecipitated using GFP antibody. The samples were applied to SDS-PAGE gels and analyzed by autoradiography. Panel A shows a representative gel from one of two experiments.

